Women and IP – the long road to equality

with thanks to Fatema Sardharwala, Katerina Hartvichova, Sally Bannan, John Gray, Jonna Sahlin, Olga Sirakova for great discussions and suggestions for the article.
We have made great strides when it comes to women’s rights in the last few decades. This year marks 40 years since the last European country granted women the right to vote – which seems both shockingly recent and impossibly long ago in terms of all the changes in the world since then.
On February 11 each year, we celebrate the International Day of Women and Girls in Science, and March 8 is widely celebrated as the International Day of Women. The month of March is known as Women’s History Month in some countries. To acknowledge these events, let us look at gender equality as it relates to our IP profession – both for inventors as well as for professional representatives. To add some more general context, data on women scientists and engineers in high-tech fields is also provided.
The goal of this article is to inform epi members of the current state of affairs – where we stand in terms of participation of women in IP. A stretch goal would be to start a conversation about how we as epi members can contribute to increasing gender diversity in our profession and beyond by removing various existing barriers. This conversation is vital for the continuing success of our profession: it is a well-established fact that diverse teams perform better in the workplacehttps://hbr.org/2016/11/why-diverse-teams-are-smarter, the conversation will facilitate us to tap into a wider pool of talent, and it is simply the right thing to do to work towards a just and egalitarian society.
The data on inventors has been provided by the European Patent Office in 2022https://www.epo.org/en/news-events/press-centre/press-release/2022/452251. The data on the gender ratio among our ranks has been provided by the epi (statistics as of December 2023). The data on percentage of women scientists and engineers in high-technology sectors has been sourced from EurostatSource dataset: hrst_st_nsecsex2, https://ec.europa.eu/eurostat/databrowser/view/hrst_st_nsecsex2.
Let us dive right in!
Figure 1 shows the percentage of women among scientists and engineershttps://ec.europa.eu/eurostat/statistics-explained/index.php?title=Glossary:Scientists_and_engineers working in high-technology sectorshttps://ec.europa.eu/eurostat/statistics-explained/index.php?title=Glossary:High-tech (high-technology manufacturing and knowledge-intensive high technology services) in 2019. The data is sourced from Eurostat and includes several other countries as well as EU member states. Overall, the percentages of women are between 13% and 34%, with a variance of over 20 percentage points with a ceiling far below parity (i.e. 50%). Note that the data for scientists and engineers overall (as opposed to in high-tech fields) looks much more equal. Among the top 10 countries with the highest percentage of women are a few Balkan states and Baltic states, Nordic countries and Spain. These countries are established champions of greater gender equality in STEM – there is a lot of research on this topichttps://esthinktank.com/2022/03/24/women-in-stem-in-the-european-union-facts-and-figures/ (outside of the scope of this article). Some common theories as to the reasons include: overall more egalitarian societies, historical circumstances and greater access to childcare. Among the bottom 10 are most DACH countries (DACH stands for Germany (D), Austria (A) and Switzerland (CH)), as well as a few of their neighbours. The UK and Sweden also make the bottom 10. The DACH countries commonly rate on the lower end among gender equality in the STEM area (but typically not in terms of the overall gender equality indexhttps://eige.europa.eu/gender-equality-index/2023/compare-countrieshttps://www.economist.com/graphic-detail/glass-ceiling-index). The average for the European Union as a whole (excluding the UK) is 21%. This appears to be on a slow upward trend – in 2022, this number was 22% (presumably, the trend would be more positive were it not for the Covid-19 pandemic, which disproportionately affected womenhttps://eige.europa.eu/gender-statistics/dgs/browse/eige/eige_covid.)
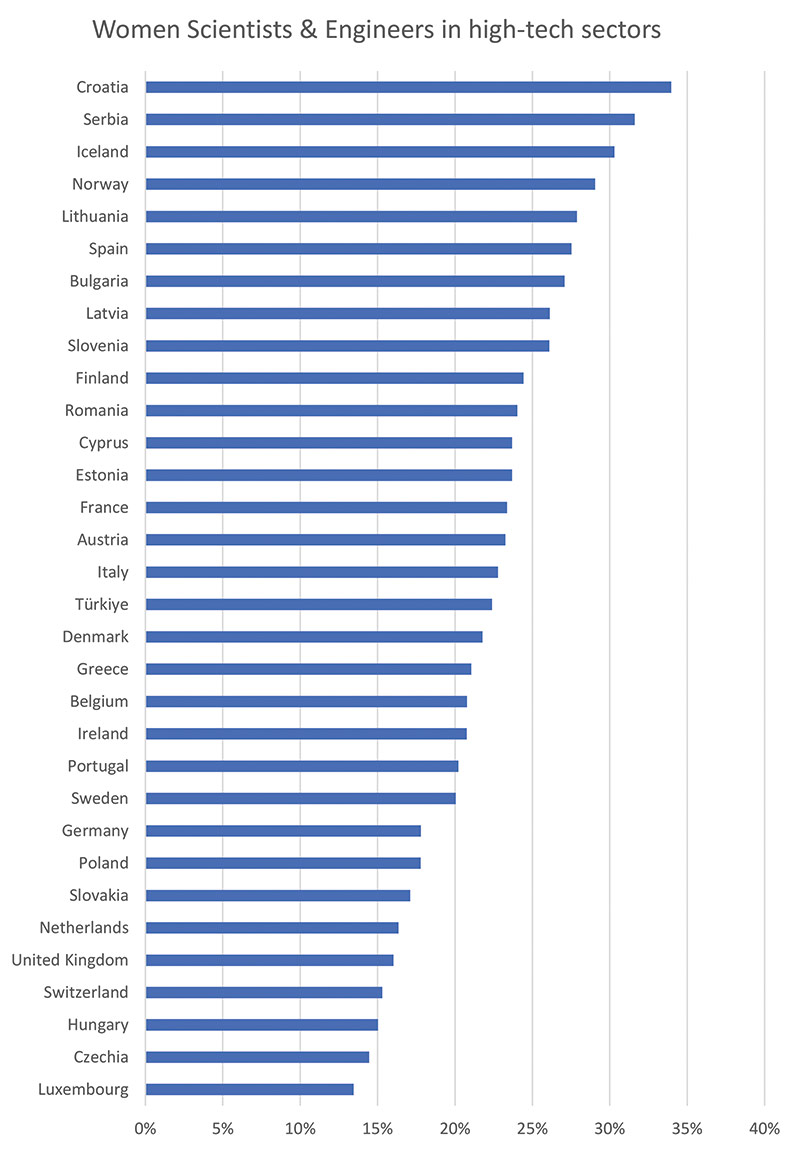
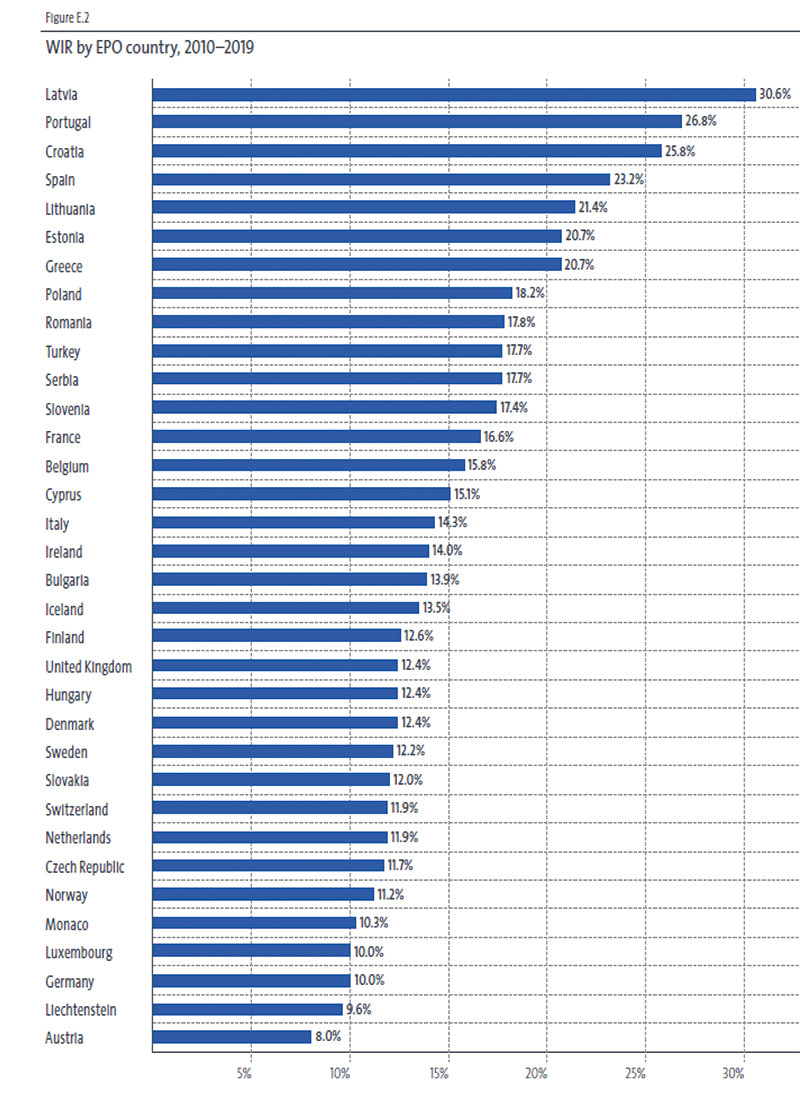
Figure 2 is reproduced from the Women’s participation in inventive activity report provided by the EPO in 2022. It shows the women inventor rate (WIR) among the EPC member states. The percentages of women inventors are between 8% and 31%, which is strikingly similar to the variance from Figure 1 above. Among the top 10 are the Baltic countries, Balkan countries, and Spain together with a couple of others. While there is some intersection between the top countries with women inventors and the top 10 countries of women scientists and engineers in high-tech sectors, there is also some divergence. The bottom 10 countries show a lot more similarity: the DACH countries score low again, as well as Czechia and the Netherlands. Overall, the average percentage of women inventors for EPC member states is 13%, which is quite a bit lower than that in high-tech STEM positions. When we talk about the gender disparity among inventors, it is important to remember that it cannot be explained solely by the so-called „leaky pipeline“ problem – i.e. the fact that women are more likely than men to leave the STEM field at each educational and career level. While this is certainly a factor, the difference between the average percentages of women in high-tech STEM fields and women inventors indicates that there are additional barriers preventing women that are already in STEM from inventing or from formalizing their inventions via patenting. There are some ongoing efforts to uncover and remove these as yet hidden barriershttps://ipo.org/index.php/diversity-in-innovation-toolkit/https://www.cisco.com/c/en/us/about/legal/win.html, but more work is needed in this area. Increasing the participation of women in patenting activities would boost the overall innovation potential in Europe. This is why this work must be urgently done, especially by members of our profession.
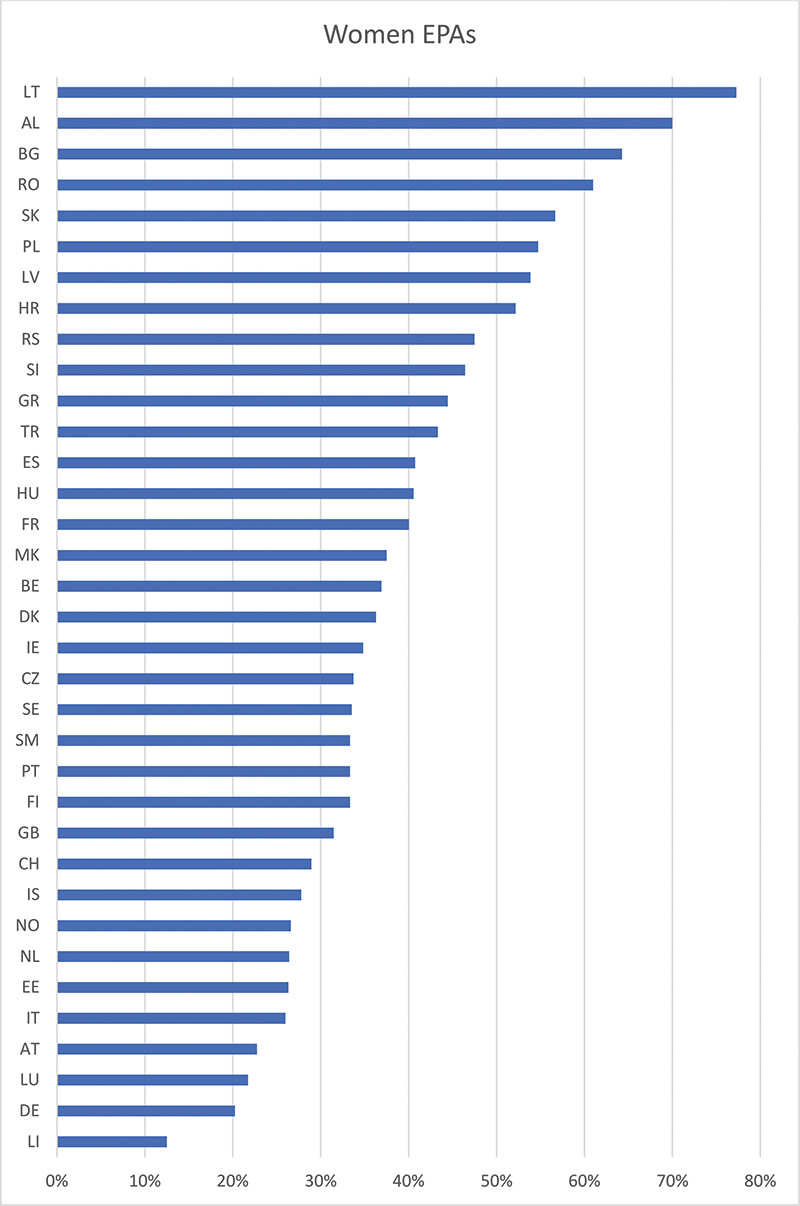
Finally, let’s take a look at the gender ratios by country for European Patent Attorneys (EPAs) in 2023, shown in Figure 3. The data excludes member states with fewer than 10 epi members. The percentages of women range from 13% to 77% in this case – a major variance as compared with the previous two figures. Overall, 29% of European Patent Attorneys are women. The top 8 countries have more than 50% women among their EPA ranks. The top 10 includes the Baltic countries, Balkan countries and Eastern European countries. Among the bottom 10 are DACH countries, Estonia (as an outlier among the Baltic countries), Italy, Netherlands and Iceland. Generally, it is important to acknowledge that the percentages of women among European Patent Attorneys are slightly higher than those among scientists and engineers in high-tech STEM fields according to Eurostat. A possible further area of investigation would be to look at the gender breakdown of EPAs according to the technical field in which they practice, and compare it with the corresponding gender statistics among scientists and engineers.
Conclusion
What are some key takeaways from this data? First, that there is a lot more work to do to strive for equality of women inventors and women in IP. Second, that we should all consider how we can contribute to improve the rather abysmal statistics on women inventors. Here are some ideas:
- You can start by taking a look at the resources on the epi page of the Diversity & Inclusion Working Grouphttps://patentepi.org/en/diversity-and-inclusion/resources.html. There are a lot of great resources elsewhere as well https://ipo.org/index.php/diversity-inclusion/https://ipinclusive.org.uk/https://www.women-in-ip.com/
- Consider contributing to the initiatives of patent officeshttps://www.dpma.de/dpma/veroeffentlichungen/patentefrauen/index.htmlhttps://www.wipo.int/women-and-ip/en/ and professional organisationshttps://www.cipa.org.uk/diversity-type/women-in-ip/.
- Highlight women inventors for awards that can increase their visibility and allow them to serve as role modelshttps://www.epo.org/en/news-events/european-inventor-award for others.
- If you are working in-house, think about how you can help remove any ‘hidden’ barriers for women inventors and launch internal initiatives aimed at increasing their numbershttps://ipo.org/index.php/diversity-in-innovation-toolkit/https://www.cisco.com/c/en/us/about/legal/win.html. This will allow your company to benefit from the brilliant inventions by the women in your R&D departments.
- If you are in private practice, aim to provide diverse teams to your clients and try to proactively approach women in R&D who may become inventors with the right encouragement and resources.
- If you work with individual inventors or startups, inform them about funding or mentorship schemes aimed at womenhttps://eismea.ec.europa.eu/programmes/european-innovation-ecosystems/women-techeu_en. Consider pro bono work with inventors from public institutions or micro entities.
When it comes to our profession as a whole, consider establishing inclusive hiring practices, making sure that your retention rates for men and women look similar (remember the leaky pipeline!), and evaluating the gender split among the leadership roles in your firm. Offer internal mentorship programs or empower your employees to participate in external oneshttps://www.women-in-ip.com/. Consider outreach to universities or professional networks and keep in mind that there are likely additional hurdles out there for women who may wish to become patent attorneys.
Finally, looking at participation of women in IP is, of course, only one aspect of the diversity and inclusion conversation. It is one that may be less relevant in some countries (especially the top 8 of Figure 3 above!), but remains an important topic in others. We should strive to continue discussing and influencing this aspect of D&I, whilst also looking at other diversity aspects and continuing to exchange best practices and knowledge.